统计学在期权定价和交易中的应用(2)
2017-05-19 编辑:
etf50[ 'rea_var'] = 252* np.cumsum(etf50[ 'returns'] ** 2) / np.arange(len(etf50))etf50[ 'rea_vol'] = np.sqrt(etf50[ 'rea_var'])print_statistics(etf50)
RETURN SAMPLE STATISTICS
---------------------------------------------
Mean of Daily Log Returns -0.000067
Std of Daily Log Returns 0.021153
Mean of Annua. Log Returns -0.016917
Std of Annua. Log Returns 0.335787
---------------------------------------------
Skew of Sample Log Returns -0.734791
Skew Normal Test p-value 0.000000
---------------------------------------------
Kurt of Sample Log Returns 4.597651
Kurt Normal Test p-value 0.000000
---------------------------------------------
Normal Test p-value 0.000000
---------------------------------------------
Realized Volatility 0.335789
Realized Variance 0.112754
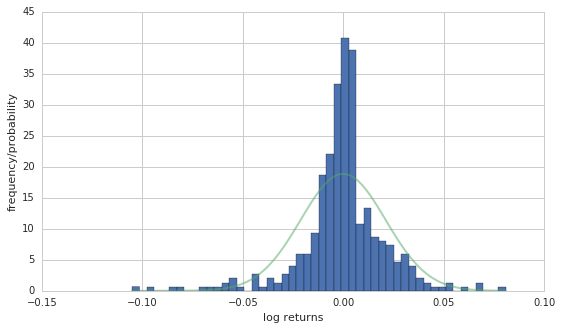
# histogram of annualized daily log returns
defreturn_histogram(data):''' Plots a histogram of the returns. '''plt.figure(figsize=( 9, 5)) x = np.linspace(min(data[ 'returns'][ 1:]), max(data[ 'returns'][ 1:]), 100) plt.hist(np.array(data[ 'returns'][ 1:]), bins= 50, normed= True) y = dN1(x, np.mean(data[ 'returns'][ 1:]), np.std(data[ 'returns'][ 1:])) plt.plot(x, y, linewidth= 2) plt.xlabel( 'log returns') plt.ylabel( 'frequency/probability') plt.grid( True)return_histogram(etf50)
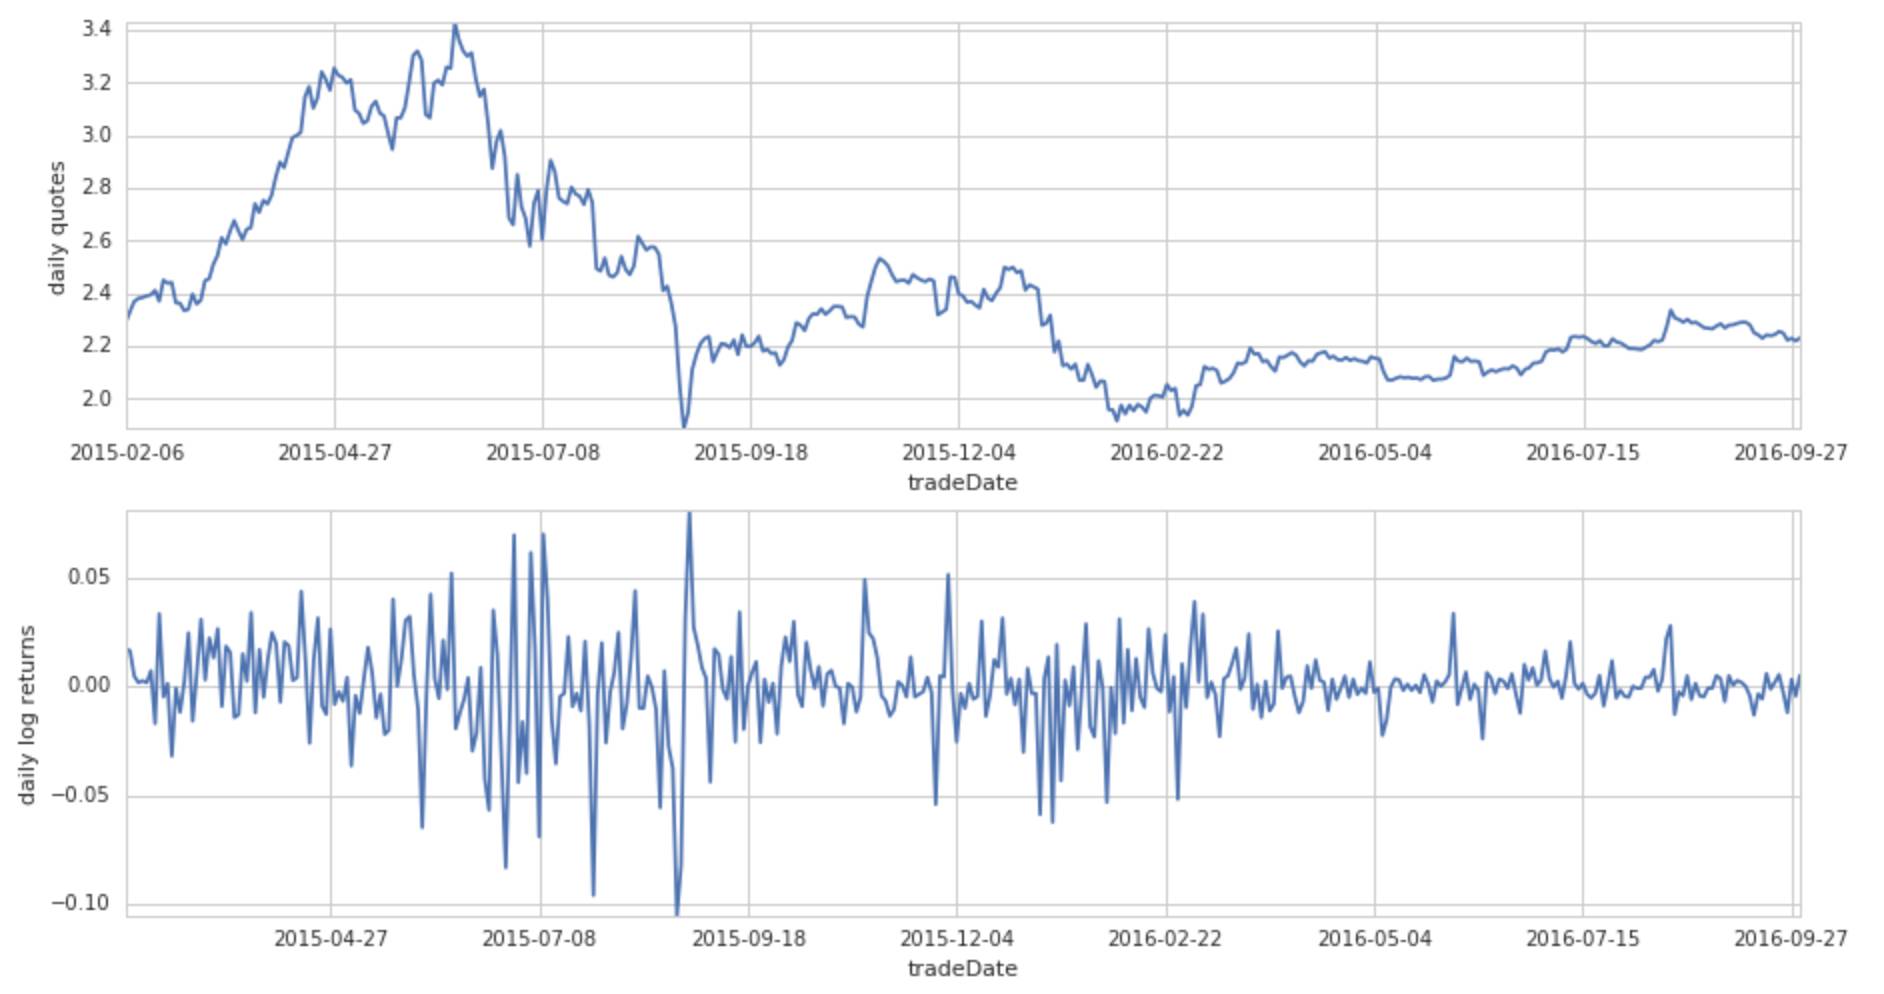
etf50.index = etf50[ 'tradeDate']quotes_returns(etf50)
期权的Greeks
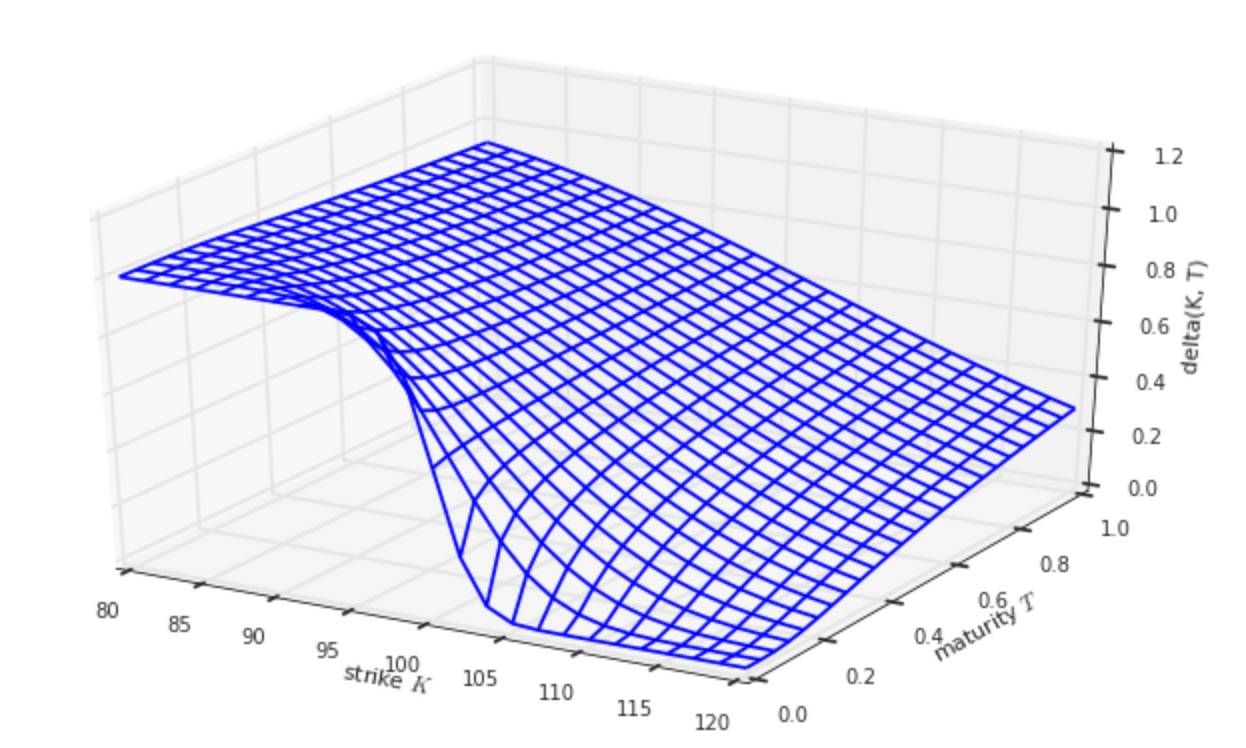
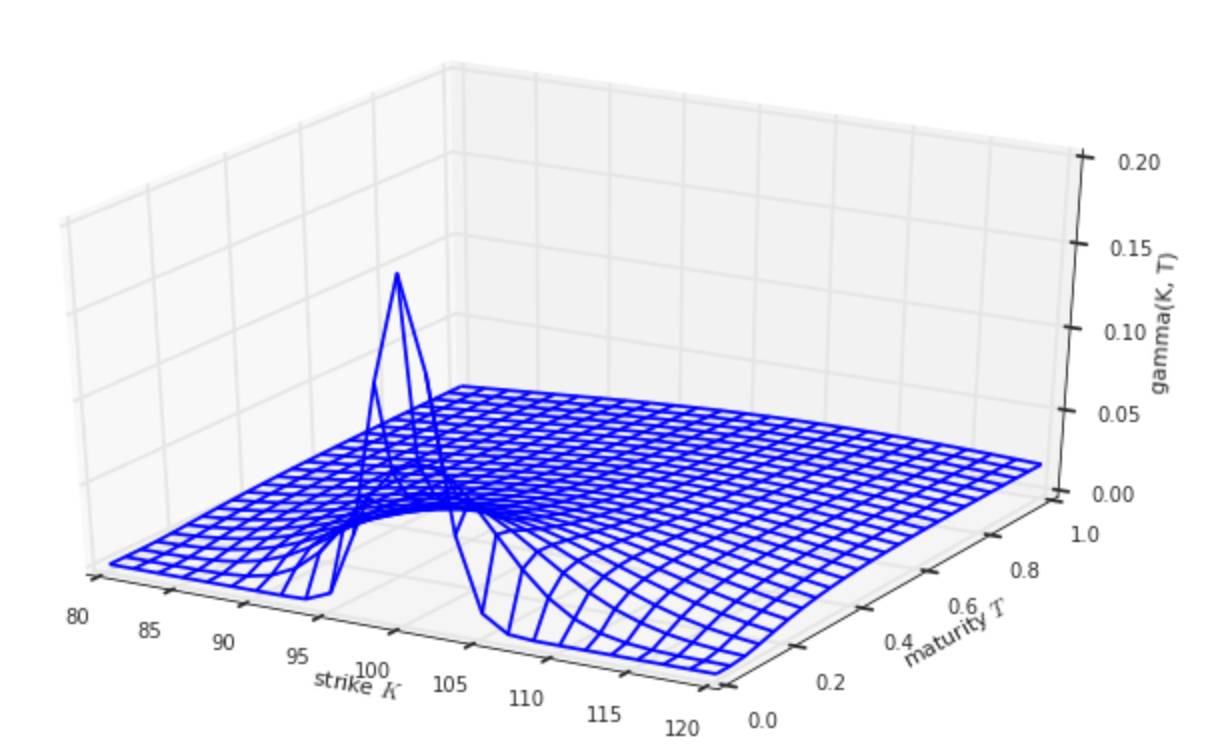
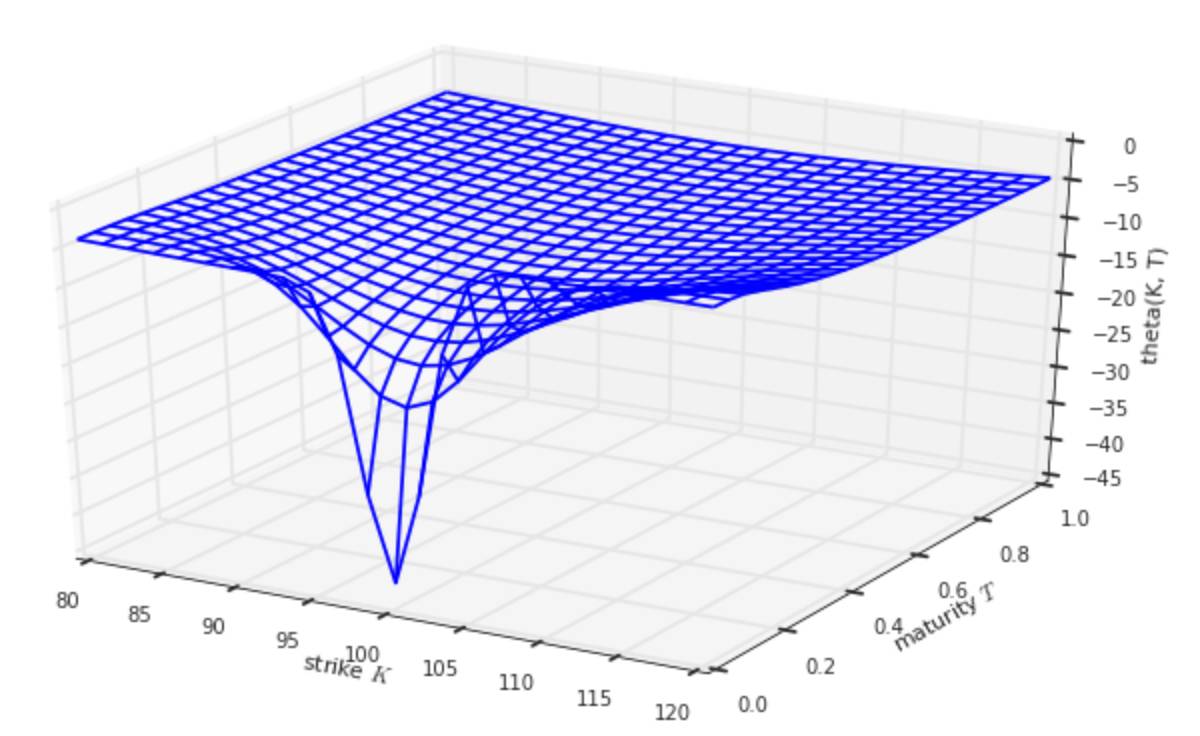
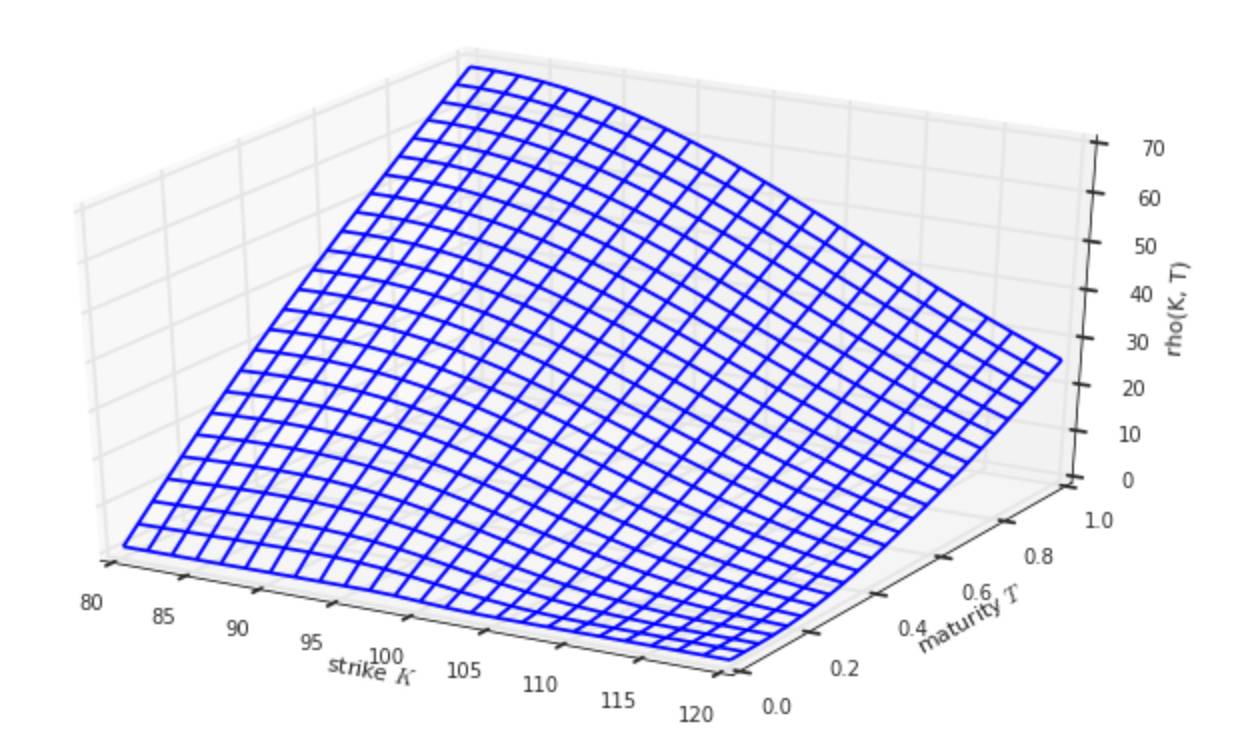
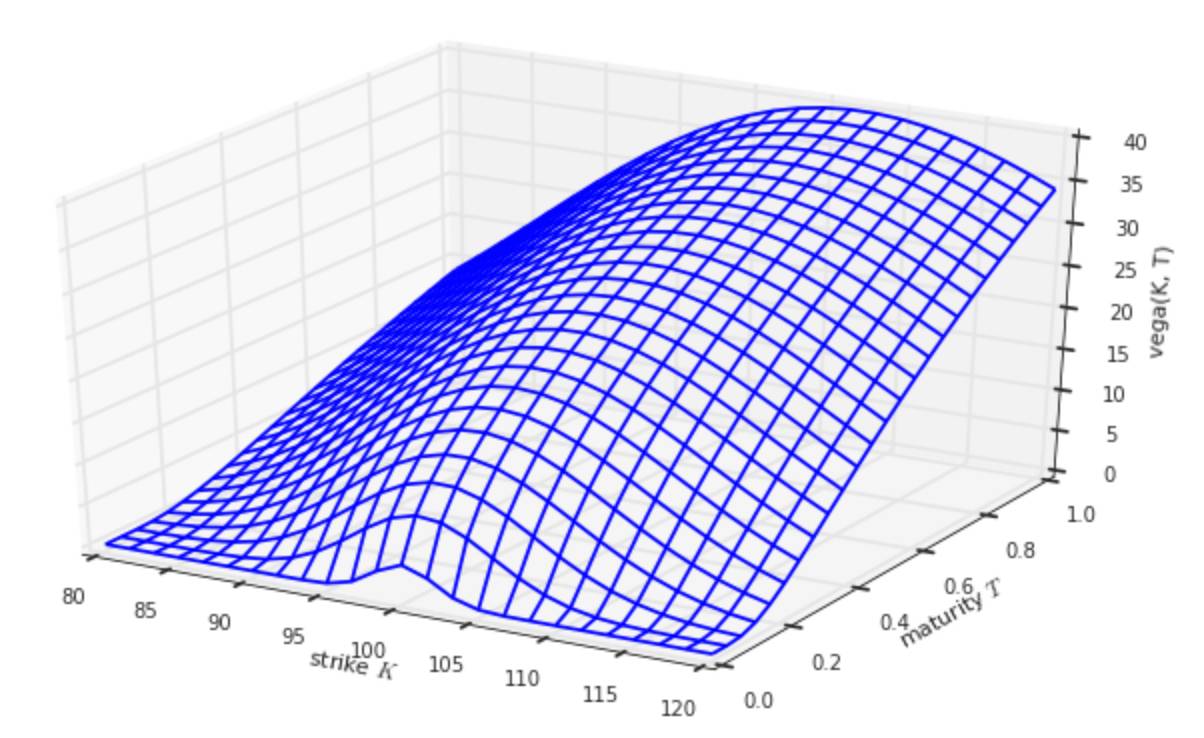
期权的Greeks主要描述了期权价格对其标的的资产价格、到期时间、波动率和无风险利率四个参数值的敏感性指标。
plot_greeks(BSM_delta, 'delta')
plot_greeks(BSM_gamma, 'gamma')
plot_greeks(BSM_theta, 'theta')
plot_greeks(BSM_rho, 'rho')
plot_greeks(BSM_vega, 'vega')
二叉树模型和BSW模型
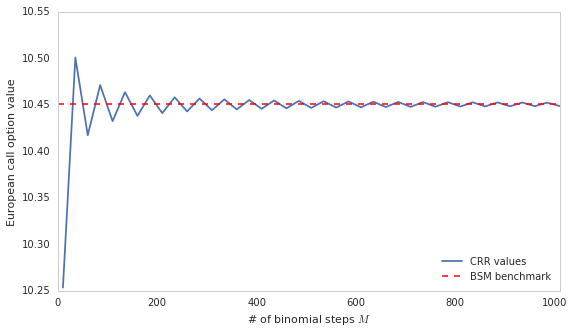
BSM_benchmark = BSM_call_value(S0, K, 0, T, r, sigma)BSM_benchmark
10.45058357218553
CRR_option_value(S0, K, T, r, sigma, 'call', M= 2000)
10.449583775457942
plot_convergence( 10, 1011, 20)
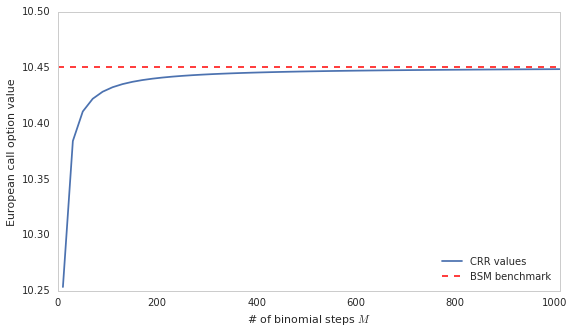
plot_convergence( 10, 1011, 25)
动态对冲
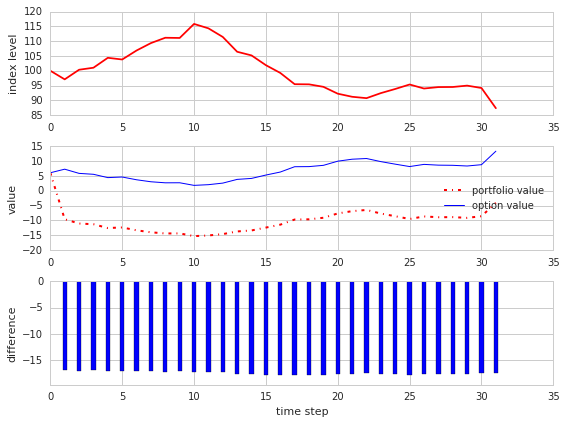
S, po, vt, errs, t = BSM_hedge_run(p= 25)
APPROXIMATION OF FIRST ORDER ----------------------------- step | S_t | Delta 1 | 97.10 | -0.46 2 | 100.34 | -0.40 3 | 101.03 | -0.39 4 | 104.38 | -0.30 5 | 103.81 | -0.32 6 | 106.85 | -0.27 7 | 109.36 | -0.22 8 | 111.16 | -0.21 9 | 111.09 | -0.20 wrong 10 | 115.83 | -0.15
(部分)
plot_hedge_path(S, po, vt, errs, t)
pl_list = BSM_dynamic_hedge_mcs(M= 200, I= 150000)
Value of American Put Option is 4.461
Delta t=0 is -0.011
run 1000 p/l 0.044
run 2000 p/l 0.042
run 3000 p/l 0.305
run 4000 p/l 0.969
run 5000 p/l -0.330
run 6000 p/l 0.093
run 7000 p/l -0.438
run 8000 p/l -0.156
run 9000 p/l -0.126
run 10000 p/l 0.187
SUMMARY STATISTICS FOR P&L
---------------------------------
Dynamic Replications 10000
Time Steps 200
Paths for Valuation 150000
Maximum 2.358
Average 0.008
Median 0.006
Minimum -1.641