华尔街太傅精华分享:从财务比率看全球股票定价(4)
2017-03-26 编辑:
之前出现过的分布走势又出现了,东欧和非洲的公司看上去依旧便宜,中国的还是很贵。从营收比率来看,加拿大和澳大利亚的公司也进入了被高估的行列,大概是因为这些地域有大量的自然能源公司。
Pricing – Sector Differences
定价-行业差异
All of the multiples that I talked about in the last section can also be computed at the industry level and it is worth doing so, partly to gain perspective on what comprises cheap and expensive in each grouping and partly to look for under and over priced groupings.
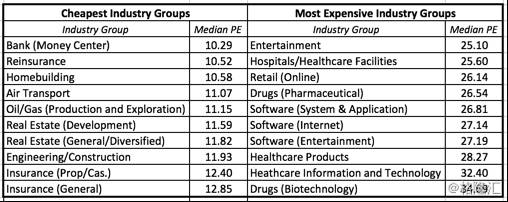
The following table, lists the ten lowest-priced and highest priced industry groups at the start of 2017, based upon trailing PE:
上个部分谈到的所有比率也可以在行业水平上进行计算,而且这样做是很有价值的,一来我们可以看看一个行业里有哪些是便宜的哪些是贵的,二来也便于搜寻低估和高估的行业。下面这张表基于既往P/E列出了2017年初股价最低的十个行业以及股价最高的十个行业。

In many of the cheapest sectors, the reasonsfor the low pricing are fundamental: low growth, high risk and aninability to generate high returns on equity or margins. Similarly, the highestPE sectors also tend to be in higher growth, high return on equity businesses.I will leave the judgment to you whether any fit the definition of a cheapcompany.
在股价最便宜的行业里,低价的原因在于基本面:增长慢,风险高,股权回报率低,利润率低。对应的,拥有最高P/E的行业其增速往往更快,也拥有更高的股权回报。这其中哪些符合你对便宜公司的定义还需要自行判断。
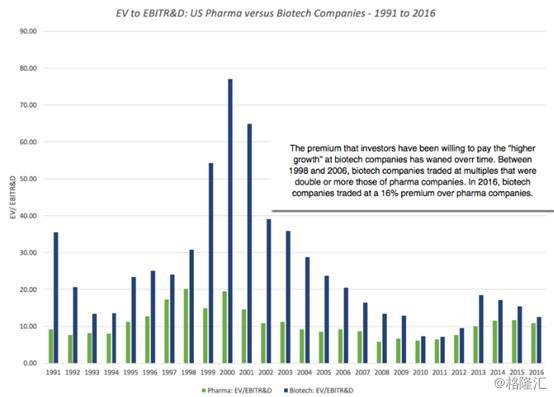
One comparison that you may consider making isto pick any multiple and trace how it has changed over time for an industrygroup. Isolating pharmaceutical and biotechnology companies in the UnitedStates, for instance, here is what I find when it comes to EV to EBITR&Dfor the two groups over time:
你可以考虑任选一个比率,追踪该比率在某个行业里会如何随时间变化。比如,单单拎出美国的制药和生物科技公司,这两个行业的EV/EBITR&D历年变化如下:

You can read this graph in one of two ways. If you are a firm believer in mean reversion, you would load up on biotech stocks and hope that they revert back to their pre-2006 premiums, but I think you would be on dangerous ground.
The declining premium is just as much a function of a changing health care business (with less pricing power for drug companies), increasing scale at biotech companies and more competition.
有两种方法分析此图。如果你十分坚定地相信均值回归,那么你会大量持有生物科技公司,期待这个行业会回复到2006年前的峰值水平,但是我觉得这样做很危险。下降趋势出现主要是因为医疗服务行业在发生变化(制药公司的定价能力被削弱),生物技术公司的规模在扩大,竞争也越来越大。
Rules for the Road
1. Absolute rules of thumb are dangerous (and lazy):
1.绝对的经验法则是危险(且懒惰)的:
The investing world is full of rules of thumb for finding bargains. Companies that trade at less than book value are cheap, as are companies that trade at less than six times EBITDA or have PEG ratios less than one. Many of these rules have their roots in a different age, when data was difficult to access and there were no ready tools for analyzing them, other than abacuses and ledger sheets.In Ben Graham's day, the very fact that you had collected the data to run his "cheap stock" screens was your competitive advantage. In today's market, where you can download the entire market with the click of a button and tailor your Excel spreadsheet to compute and screen, it strikes me as odd that screens still remain based on absolute values.
If you want to find cheap companies based upon EV to EBITDA, why not just compute the number for every company (as I have in my histogram) and then use the first quartile as your cut off for cheap. By my calculations, a company with an EV/EBITDA of 7.70 would be cheap in the United States but you would need an EV to EBITDA less than 4.67 to be cheap in Japan, at least in January 2017.
投资这行里多的是寻找便宜股票的经验法则。比如:交易价格低于账面价值的公司就是便宜的,或者只有6倍EBITDA的公司才是被低估的,再或者PEG(市盈增长率)低于一的公司才是被低估的。在过去,这些法则是站得住脚的,但这是因为那时候数据难以获取,除了算盘、账本就没有别的现成工具研究公司了。在本·格雷厄姆那个年代,会收集数据让他的“便宜股票”筛选器动起来就已经足够有竞争优势了。
在现在的市场里,你只需要点击一下就可以下载整个市场的数据,就可以做一张Excel表格计算然后进行筛选,但让我感到很奇怪的是现在的筛选仍旧是基于绝对价值。
如果你想要根据EV/EBITDA比率找到便宜的公司,那为何不直接计算出每家公司的EV/EBITDA(想我在文中的柱状图中做的一样),然后把前面的四分之一选出来做便宜的公司呢。据我计算,在美国,一家公司的EV/EBITDA达到7.7就算股价便宜了,但是在日本这个数字得到4.67,至少这个情况在2017年1月来看是如此。
2. Most stocks that look cheap deserve to be cheap: